Key Takeaways
- Legacy machines with working PLCs can be upgraded with custom dashboards: no PLC programme changes needed.
- We built a real-time OEE dashboard reading directly from a VIPA S7-300 PLC over Ethernet.
- The system runs locally on an industrial PC: no cloud, no subscriptions, no internet required.
- Operators now see live fault monitoring, shift comparisons, and production trends that were previously invisible.
The Problem
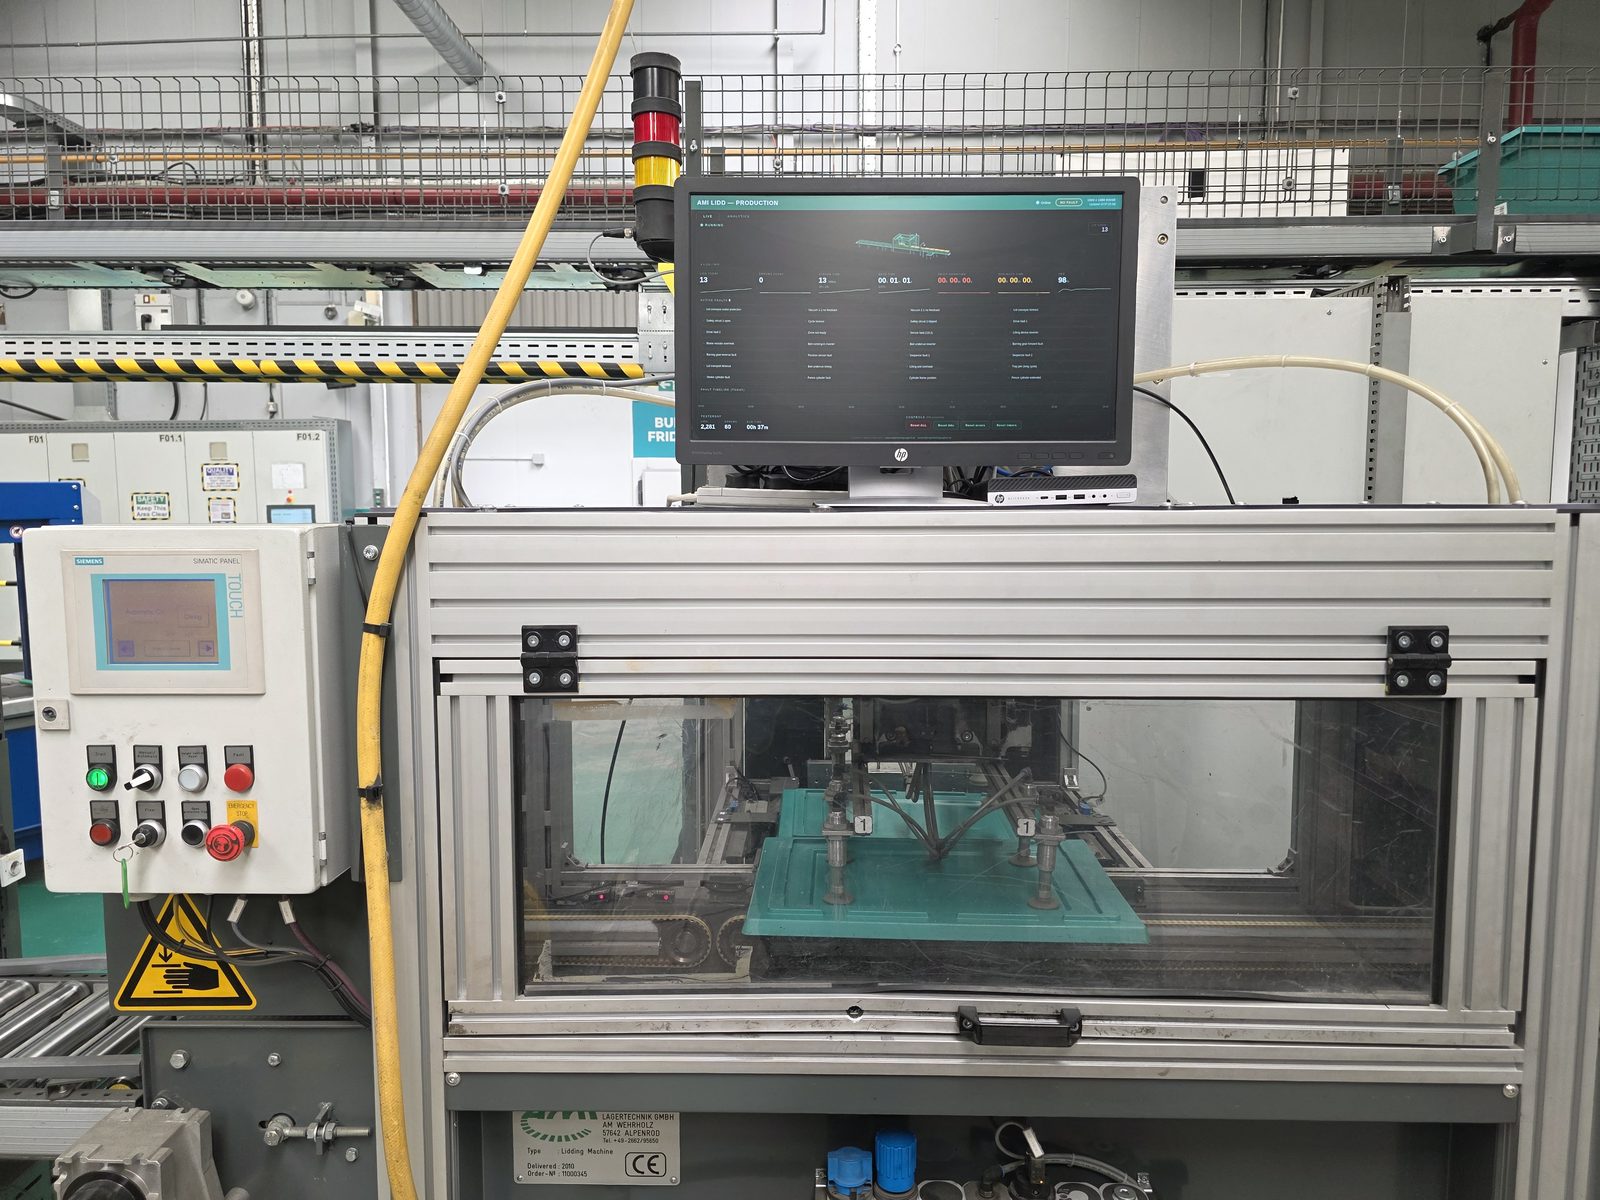
One of our clients runs a lidding machine built by AMI. That company, unfortunately, is no longer in business. The machine itself works fine. Mechanically, it's solid. The PLC programme does its job. But the operator interface? That's where things get frustrating.
The existing HMI is a Siemens TP177A, a small touchscreen panel that was standard kit about fifteen years ago. This is a common challenge we see in industrial automation and control projects. It shows the basics: a few counters, some status bits, and a handful of diagnostic screens you have to tap through one at a time. If you want to know how many lids the machine ran today, you can find that. But if you want to know how well it ran, or why it stopped three times before lunch, or whether today's output is better or worse than last week. You're on your own with a clipboard.
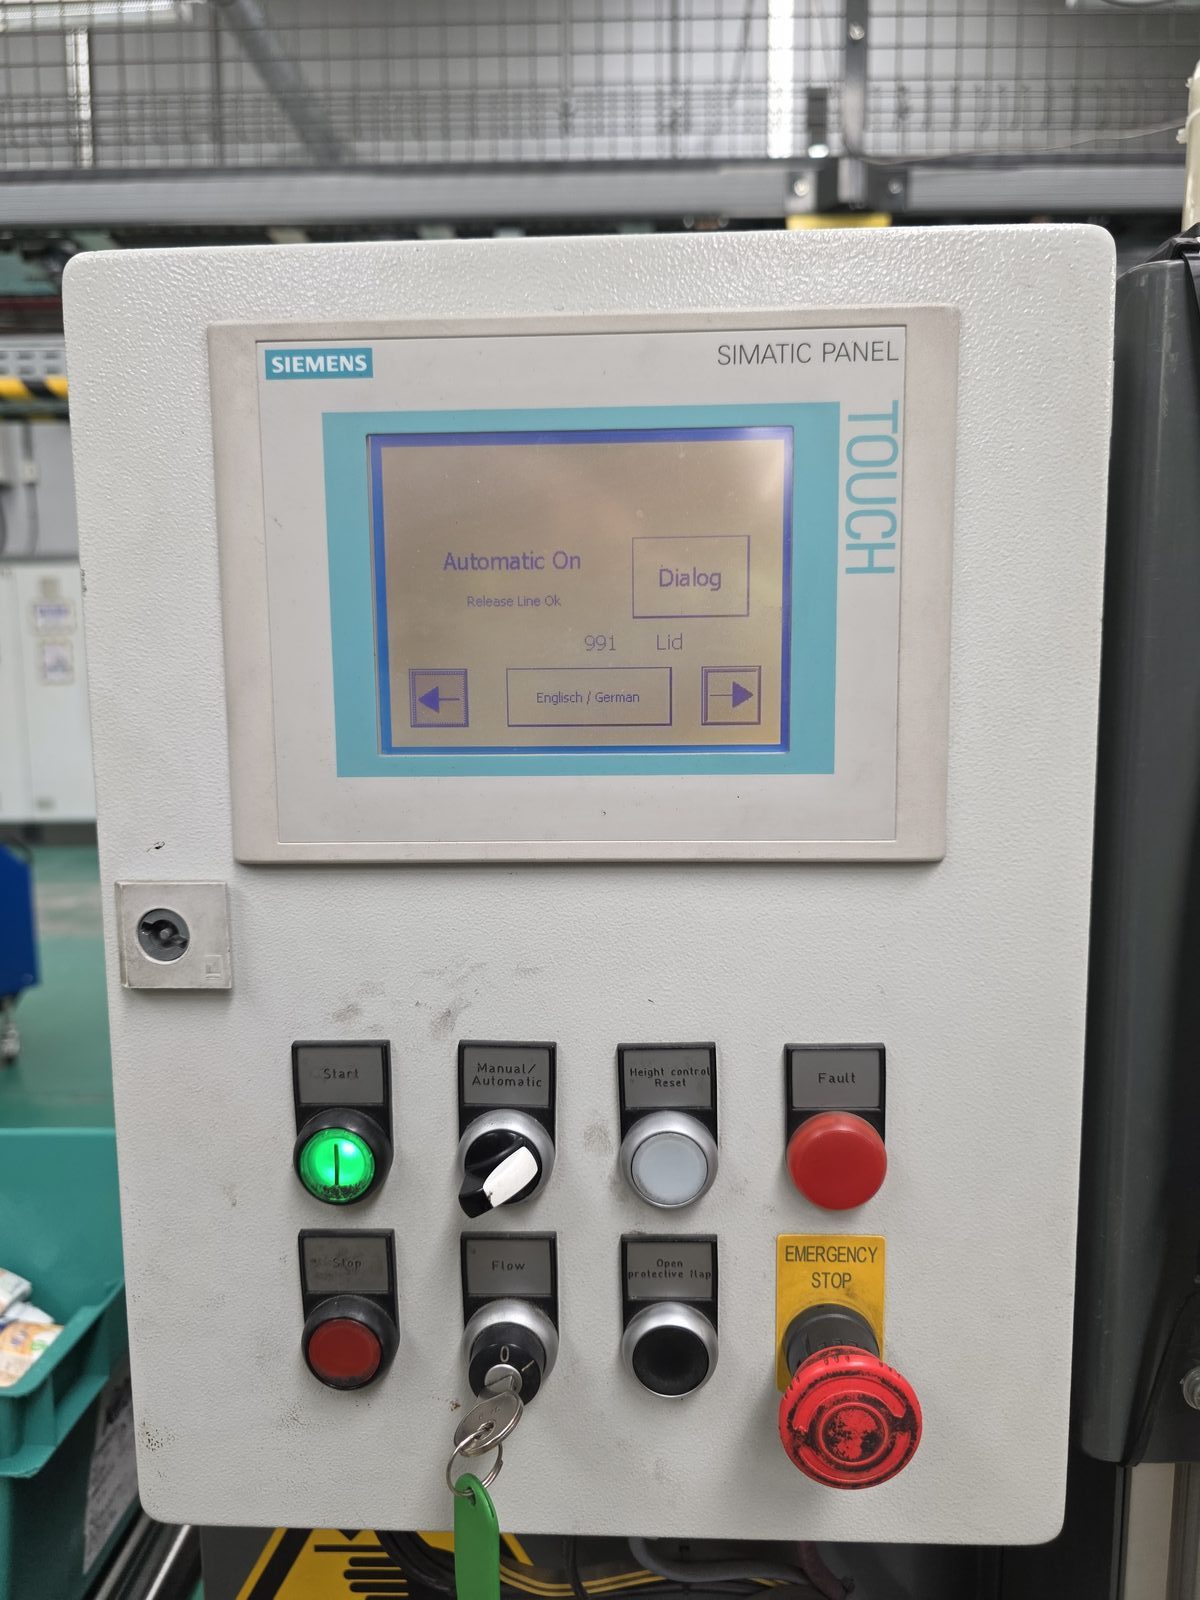
With AMI gone, there's no one to call for an upgrade. No software updates, no new features, no support contract. The machine is effectively orphaned. So we decided to do something about it.
What We Built
We connected a small industrial PC directly to the machine's PLC over Ethernet and built a custom web-based dashboard, a practical example of our control and automation capabilities that runs on a screen mounted right next to the line. No cloud services, no subscriptions, no internet connection required: everything runs locally on the factory network.
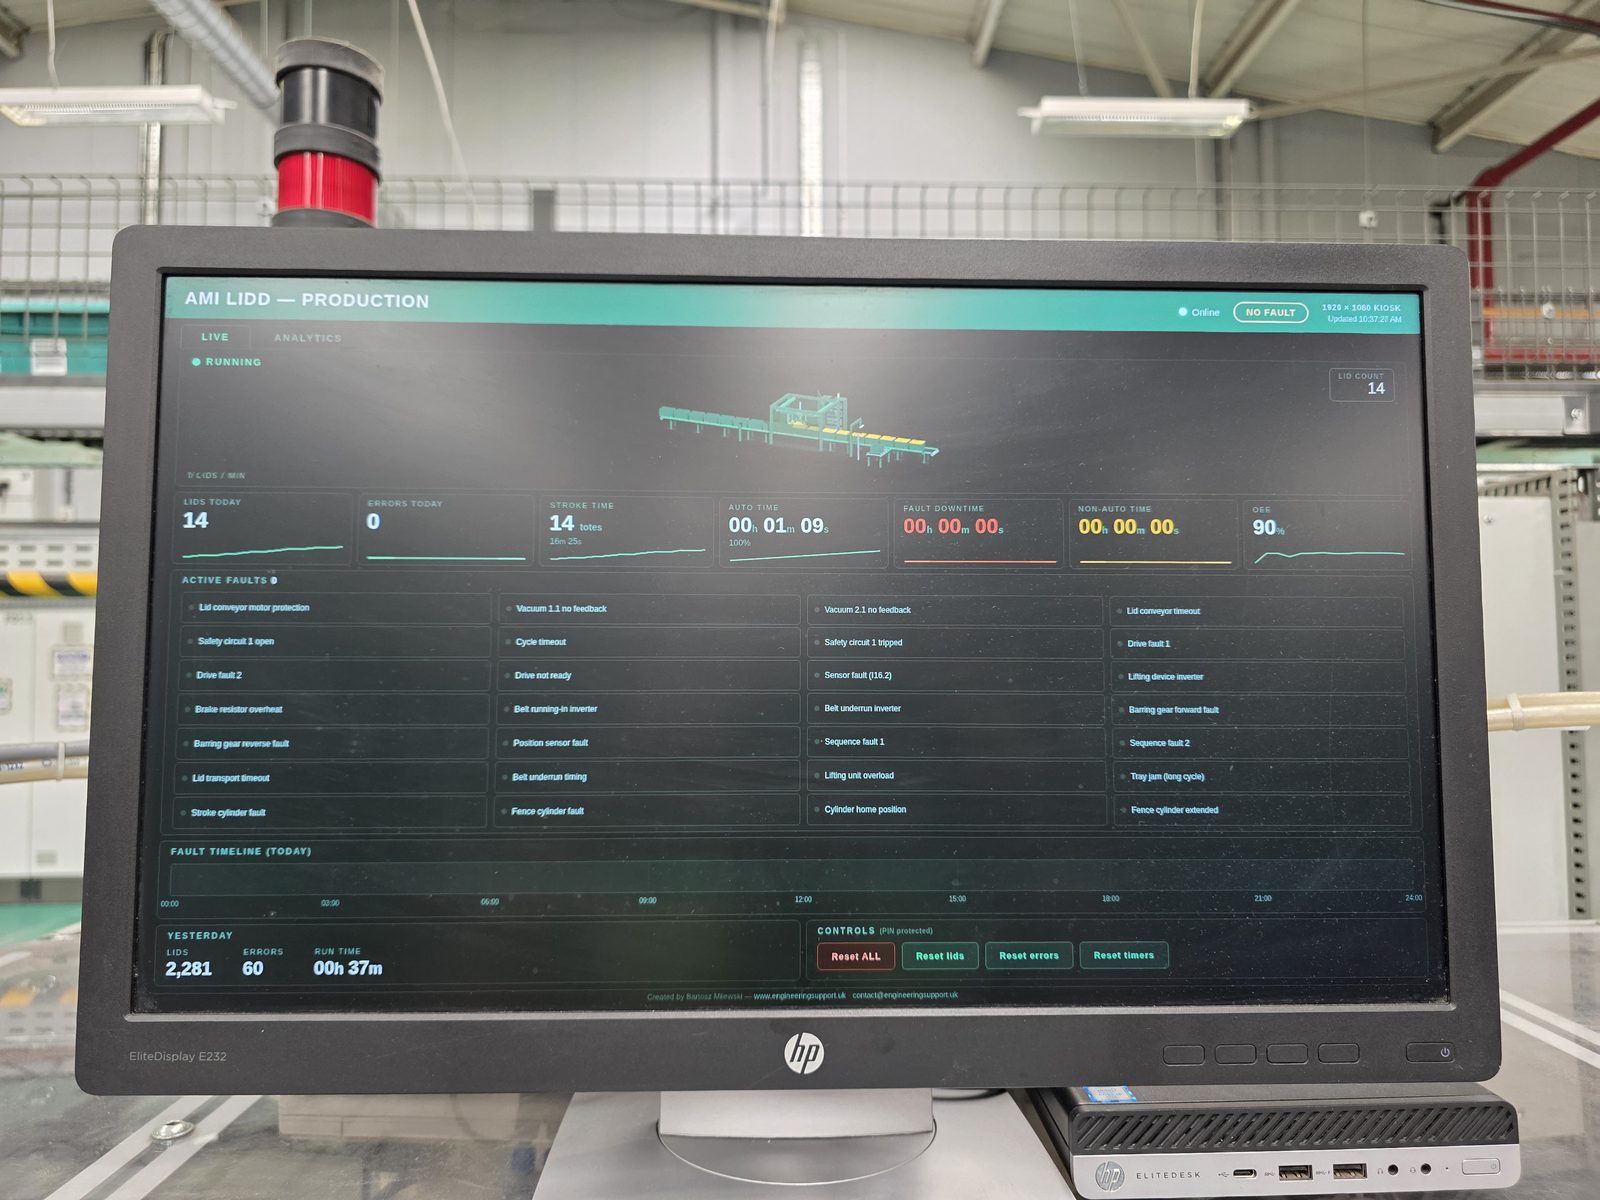
The dashboard reads data straight from the PLC every second and presents it in a way that's actually useful to the people running the machine. Here's what it shows:
- Live production counters: lid count, error count, run time, fault downtime, and non-auto time, all updating in real time.
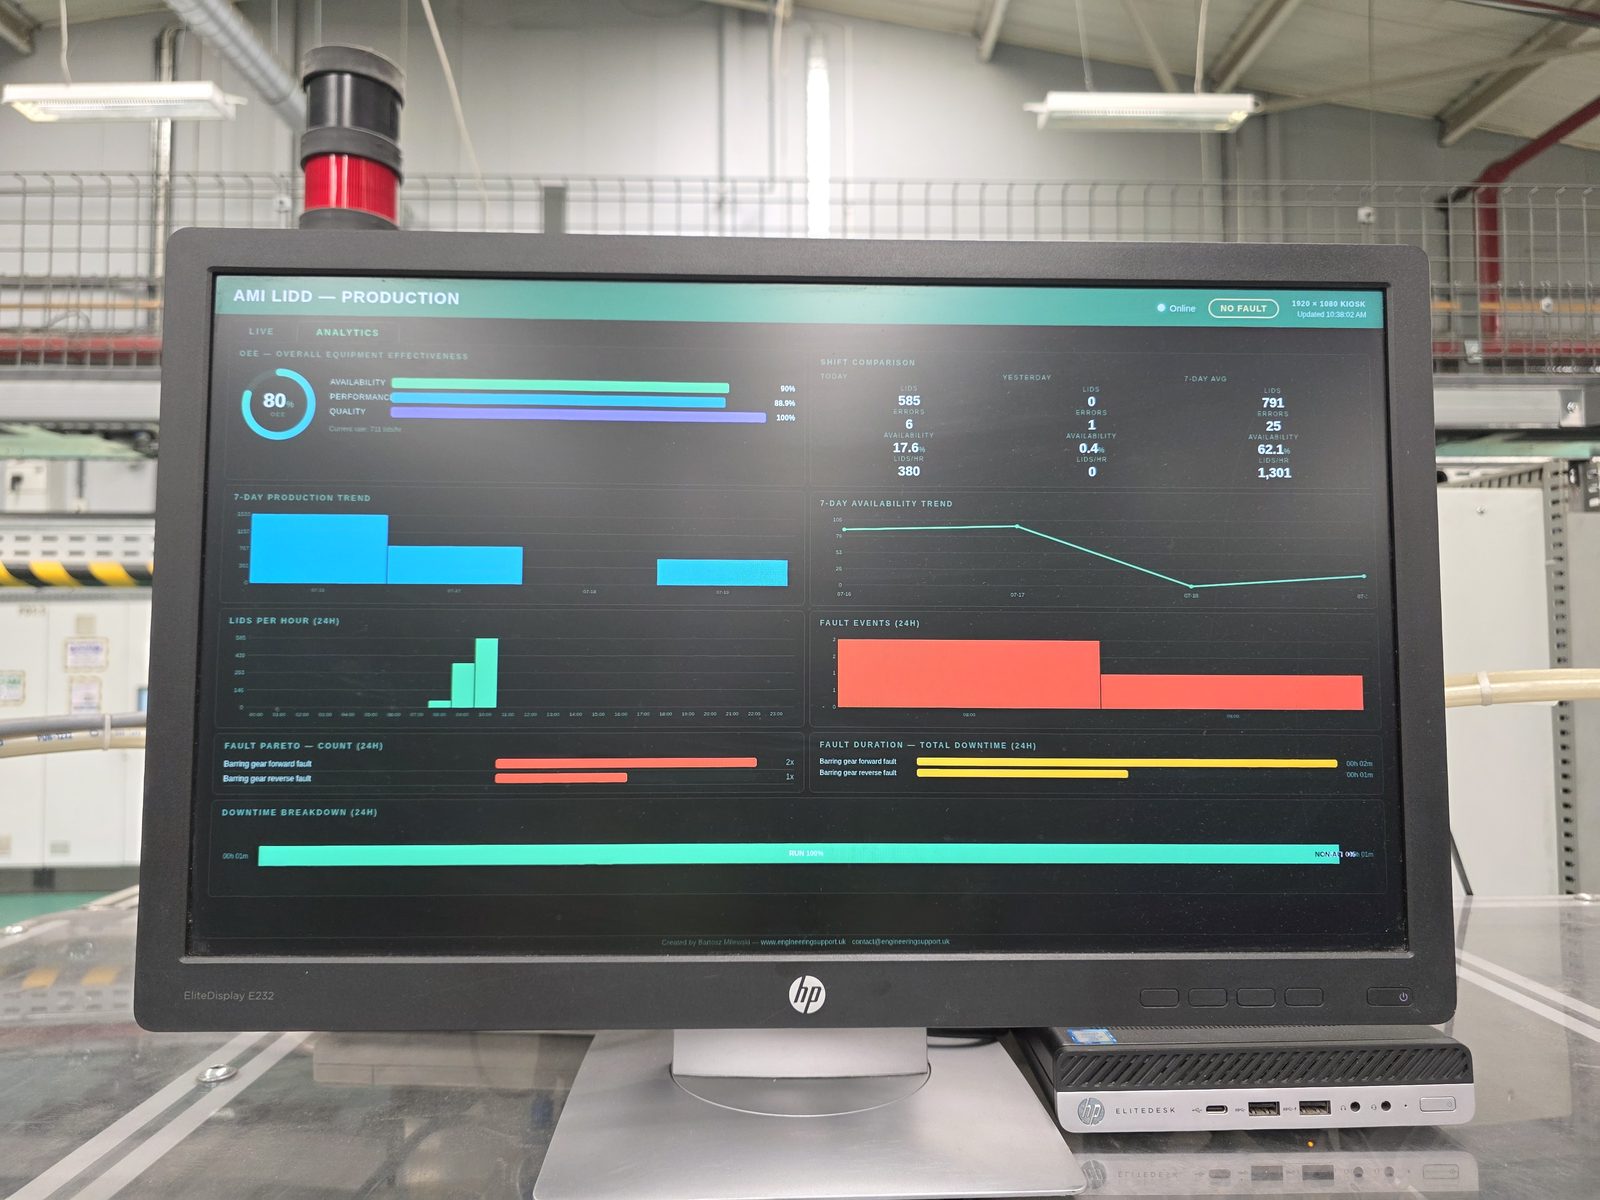
- OEE calculation: availability, performance, and quality broken down with gauges, so you can see at a glance whether the line is hitting its targets.
- Animated machine visualisation: a live graphic of the lidding station that shows conveyor movement, piston action, and colour-coded status (green for running, amber for stopped, red for fault). You can see the machine state from across the room.
- Individual fault monitoring: we mapped all 27 fault bits from the PLC programme to human-readable names. Instead of seeing just "FAULT ACTIVE" and having to dig through HMI screens, the operator sees exactly which fault is active: "Lid conveyor timeout", "Vacuum 1.1 no feedback", "Safety circuit tripped", each one with a red or green indicator.
- Fault timeline: a Gantt-style chart that shows exactly when faults happened during the shift. Patterns jump out immediately. Is the same fault repeating every 45 minutes? Do problems cluster after a changeover? This kind of insight was simply invisible before.
- Alarm history and Pareto analysis: a scrollable log of every fault event with timestamps and durations, plus a breakdown chart showing which faults happen most often. If one fault is responsible for 60% of your downtime, you'll see it straight away.
- Shift comparison: today's performance side by side with yesterday and the 7-day average. Each metric is colour-coded: green arrow if you're doing better than average, red if you're behind. No mental arithmetic needed.
- Production trends: 24-hour, 7-day, and 30-day charts showing output over time.
How It Works Under the Hood
The machine runs on a VIPA CPU 312SC, which is S7-300 compatible. We communicate with it using the S7 protocol over Ethernet, reading data blocks and marker bits directly from the PLC memory. There's no additional hardware needed on the PLC side, no programme changes, and no risk to the existing automation. We're purely reading data.
The application itself is written in Python using Flask, with a SQLite database for storing historical data. Every minute, it logs a snapshot of the production counters and tracks individual fault events with start and end times. The front end is a single HTML page with vanilla JavaScript: no frameworks, no build tools, no dependencies that could break in five years. It's designed to run unattended on a factory floor for months without anyone touching it.
The industrial PC runs Debian Linux in kiosk mode: it boots straight into a full-screen browser showing the dashboard. No desktop, no login screen, no way for someone to accidentally close it. Power goes out, power comes back, dashboard is running again. That's it.
Why This Matters
This project is a good example of what's possible when you have a working machine but limited visibility into how it's performing. The PLC was already counting lids, tracking run time, and monitoring faults. All that data was sitting there in memory, it just wasn't being presented in a useful way.
We didn't need to modify the PLC programme. We didn't need to replace any hardware. We didn't need the original manufacturer's involvement. It's the same approach we bring to all our engineering projects: work with what's already there and make it better. We just needed to understand the existing system well enough to extract what mattered and put it on screen.
The result is that the operators and production managers now have real-time OEE data, historical trends, and detailed fault analysis, things that would normally require an expensive SCADA system or a manufacturer's software package. And because it's a web application, anyone on the factory network can pull it up on their phone or office PC too.
Can We Do This for Your Machine?
If you've got a machine with a PLC, whether it's Siemens, VIPA, Allen-Bradley, or something else, and you feel like you're not getting enough information out of it, this is exactly the kind of project we enjoy. Our lead engineer, Bartosz Milewski, has over a decade of experience working with industrial control systems across Scotland's manufacturing sector. Maybe your HMI is outdated, maybe your original integrator has disappeared, or maybe you just want better visibility into what your equipment is actually doing all day.
We can work with your existing PLC programme, read the data that's already there, and build you something that genuinely helps your team make better decisions on the factory floor. No unnecessary complexity, no ongoing licence fees, and no changes to your running automation.
Get in touch if you'd like to talk about it: contact@engineeringsupport.uk or visit our contact page.